Architecture and Justice
Mapping criminal justice statistics to make visible the geography of incarceration and return
September 15—October 28, 2006
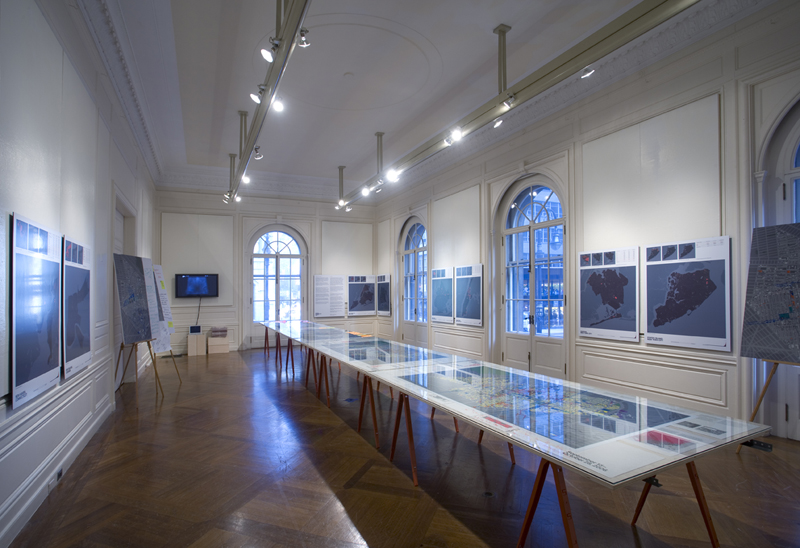
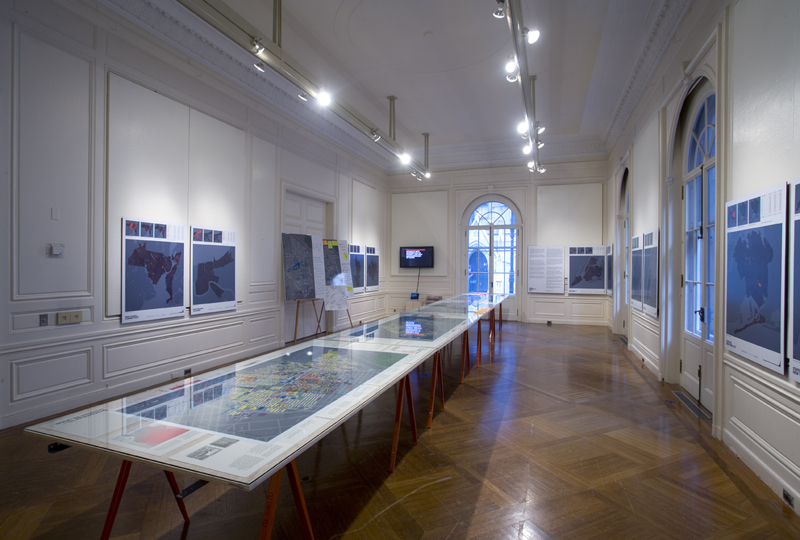
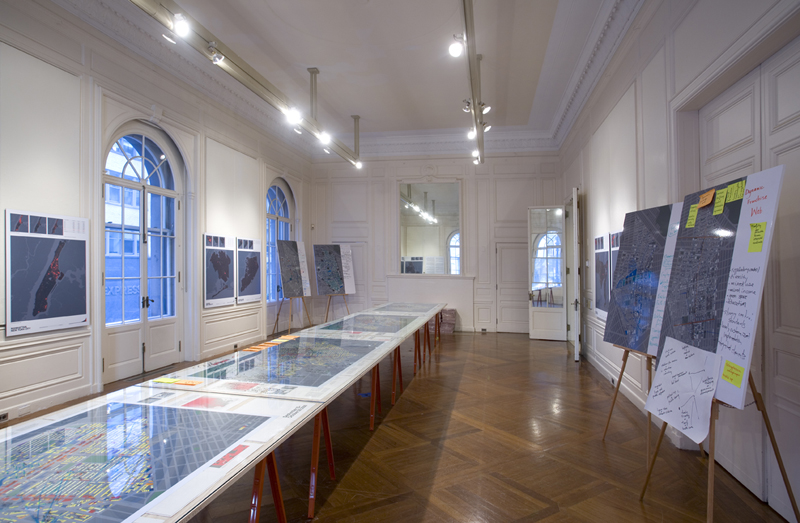

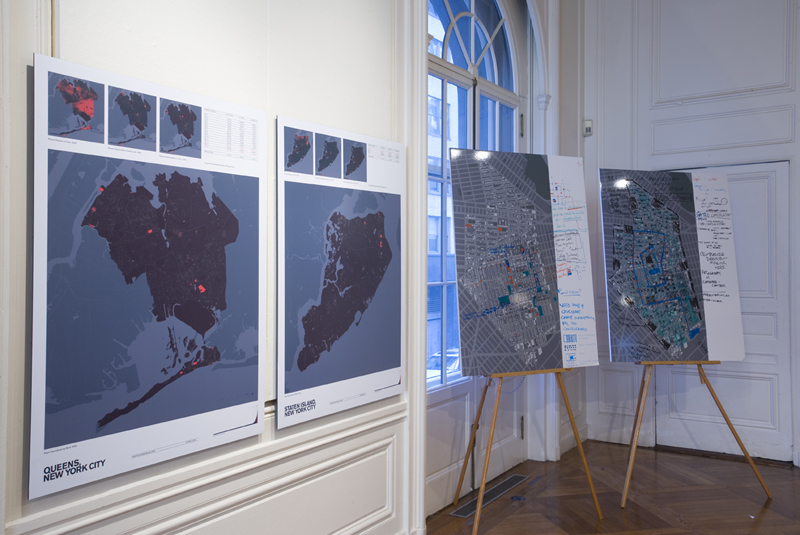
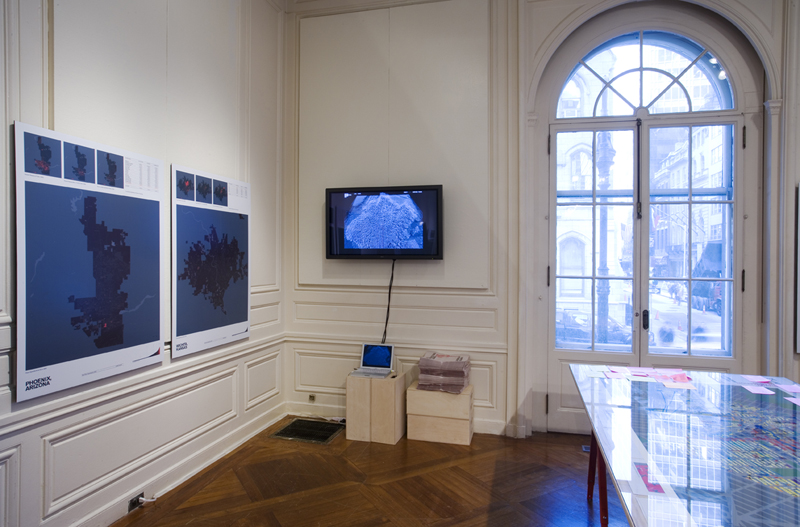
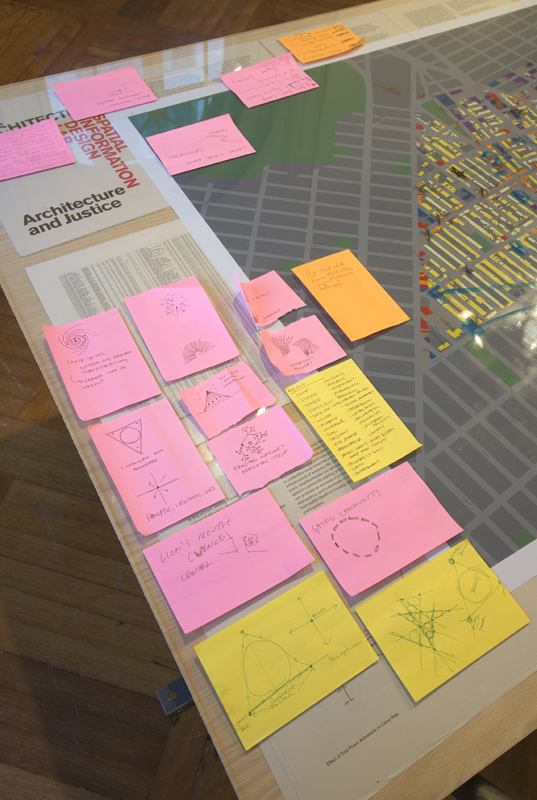
Architecture and Justice mapped criminal justice statistics to make visible the geography of incarceration and return in New York, Phoenix, New Orleans, Wichita, and New Haven, prompting new ways of understanding the spatial dimension of an area of public policy with profound implications for American cities. In 2006, the United States had more than two million people locked up in jails and prisons, a disproportionate number of whom come from a small number of neighborhoods in the country’s biggest cities. In many places, the concentration was so dense that states spent in excess of a million dollars to incarcerate the residents of single census blocks. In fall 2006 the Architectural League presented the exhibition Architecture and Justice, created by the Spatial Information Design Lab (SIDL) at Columbia University and the Justice Mapping Center (JMC), which worked together to use the language of design to suggest new ways of understanding problems of incarceration and poverty in American cities.
The exhibition included maps of Phoenix, New Orleans, Wichita, New Haven, and each of the five boroughs of New York City, illustrating prison expenditures by administrative district. Smaller maps of each city illustrated poverty and population density, and an enlarged and detailed map focused on Brownsville, Brooklyn. Additionally, a digital projection enabled viewers to manipulate maps to compare different types of data.
Architecture and Justice was organized by Laura Kurgan and Eric Cadora. It was made possible, in part, by Graphical Innovation in Justice Mapping, a grant from the Open Society Institute and the Jeht Foundation to the Spatial Information Design Lab.
Curated by Gregory Wessner